ALBURYCITY / INDEPENDENT COMMUNITY FINANCIAL REVIEW / OCT 2026
Where did
the money go?
Council finances in plain English. Explore the facts, compare choices and check the original sources.
AI-assisted community review · Not an audit or Council publication. Methods and interests disclosure ↗
PUBLIC INFORMATION2018–2025 FINANCIAL RESULTS
THE FOUR NUMBERS THAT MATTER · FY2025
Strong assets. Tighter choices.
Council has valuable assets, but the General Fund is under pressure. Here is what the accounts say — without the jargon.
LATEST PUBLISHED AUDITED FUND BALANCES · 30 JUNE 2025
Source: FY2025 accounts, Note D1-2 ↗Where the money sits
Three separate funds. These are bank and investment balances — not profits or money Council can spend on anything.
GENERAL FUND
$66.2mCash and investments$41.7m not externally restricted
Net assets: $1.374bn · includes roads, buildings and other infrastructureWATER FUND
$75.5mCash and investments · restrictedWater supply activities and infrastructure
Net assets: $383.6mSEWER FUND
$89.0mCash and investments · restrictedWastewater services and infrastructure
Net assets: $361.2mCombined cash and investments: $230.7m. The General Fund has other externally restricted amounts; its $41.7m not externally restricted is not necessarily uncommitted or available for spending. Net assets are the value of assets less liabilities, not cash.
What happens next: In its 2026–2036 base scenario, consolidated closing debt reaches $532m by 2036, and annual borrowing costs reach $28.9m. Explore the ten-year forecast and 172 proposed projects →
Have your say: Try a service, projects and workforce scenario in the community budget calculator →. It separates operating savings from capital project deferrals and redundancy costs.
What this does not say: AlburyCity is not shown to be insolvent. The key issue is whether its day-to-day income and spending, together with its long-term asset plans, are sustainable.
01 / WHERE THE INCOME COMES FROMCouncil General Fund base plan, p2 ↗
Where the money comes from.
How much comes from rates, fees and grants? The table shows each source and its share of the General Fund total.
GENERAL FUND / 2026–27 FORECAST
$173.98m
Total income, including $45.10m capital grants. These help build assets but do not fund routine services each year.
THE KEY DISTINCTION$128.88m
Income excluding capital grants and contributions. Rates and annual charges are 51.8% of this narrower income total; they are not all ordinary land rates.
Source: 2026–2036 Base Scenario, General Fund, page 2 ↗. Rounded figures and shares of the total; 2026–27 forecast, not FY2025 actuals.
Compare the two calculators—not their recommendations.
AlburyCity's official Special Rate Variation impact calculator ↗ estimates how proposed rate scenarios might affect an individual property's rates. This independent community calculator explores operating, service and funding choices. We do not advocate for or against an SRV. Council's scenarios are proposals, not approved rate increases.
02 / THE P&L: OPERATING RESULTSFinancial statements, p4 ↗
A surplus can hide a shortfall.
Capital grants help the headline result. Removing them shows whether regular income covers regular costs.
Operating results over time
Audited financial statements, FY2018–FY2025, $ million. Starts at FY2025; choose any year.
Reported result Without capital grants
THE IMPORTANT SPLIT
Fund balances and annual results—side by side.
The fund balance is what Council holds at year-end. The operating result is income less expenses during the year. They are not the same thing.
Each fund card separates cash and investments (balance sheet) from its annual operating result before capital grants (P&L). Amounts by fund include internal charging and recoveries; do not add them to independently constructed service budgets. 2025 Notes D1-1 and D1-2 ↗
03 / THE P&L: SERVICE COSTS2026 service catalogue ↗
What each service costs.
Compare published income, spending, staff and services across 45 teams. These are budget figures, not audited savings.
Ten clusters: follow the money
Published budget lines: income, expenses, depreciation and analytical net cost. Financial Management’s central collections are excluded from cluster income, but its expenses remain included.
Where is Marketing? It is a separate Business & Lifestyle service (2 ongoing FTE), not Communications & Engagement. The catalogue says its costs are spread across other Business & Lifestyle budgets. Source: page 46 ↗
Criticality & disruption impact
Bubble area is proportional to the gross service expense budget. Both axes are AI-generated, unverified estimates. No human has scored, favoured or promoted any service or cluster. Only ten priced services have AI placeholder scores; others are not plotted. This is not an expert or statutory assessment.
10 PRELIMINARY SCORES
Smaller budget Larger budgetAI-generated positions only · no human ranking · not statutory classifications.
Browse every named service
Showing 45 services
These are 2026 catalogue budgets, not actual spending. 44 services have separate published expense lines. Marketing is included in other budgets. Financial Management holds centrally recorded income. Internal allocations mean these totals are not audited consolidated expenditure.
THE FUNDING REALITY
Money raised for water and sewer belongs to water and sewer.
Those reserves cannot simply cover a shortfall in unrelated Council services.04 / RESTRICTED CASH & INVESTMENTSFinancial statements, p29 ↗
Most cash has rules.
Water, sewer and other funds are restricted. Only some money can support general community services.
Where the money sits
Cash and investments at each 30 June, $ million.
Water Sewer Other restrictions Not externally restricted
Protected funds
NSW financial reporting rules treat water and sewer as separate funds. Their restricted resources are intended for those activities, even though Council manages them together.
NSW Office of Local Government guidance ↗Unrestricted ≠ spare
Even cash not subject to external restrictions can be allocated to commitments, employee entitlements, projects and normal day-to-day working capital.
See Note C1-3 in the 2025 accounts ↗05 / LOANS, INTEREST & REPAYMENTSCash flow statements, p8 ↗
Debt is rising.
See what Council borrowed, repaid and still owes — plus what interest costs each year.
Outstanding loans
Closing debt at 30 June, $ million
Loans in. Repayments out.
Annual cash flows, $ million. Green is new debt; coral is principal repaid.
Loans received Principal repaid
What borrowing costs
Borrowing expense recorded in the income statement, $ million.
Cash borrowing payments are included in the detail table. FY2024 cash outflows show an unusually high amount that needs separate reconciliation; they are not treated as recurring interest expense.
Eight years in one view2018–2025 / AUD million · hover a line for values
The full year-by-year table is below. These are actual past amounts, not future forecasts.
See every year — loans, repayments and interest
| Year ended | Opening loans | New loans | Principal repaid | Net movement | Closing loans | Borrowing expense | Source |
|---|
06 / ASSETS AND BALANCE SHEETBalance sheet, p6 ↗
What Council looks after.
Roads, parks, pipes and buildings serve residents. They cost money to maintain and eventually replace.
COUNCIL ASSETS / 2025$2.29b
INFRASTRUCTURE & OTHER FIXED ASSETS$2.02b
DEBT OWED / 2025$93.3m
WHAT WE ACTUALLY LOOK AFTER
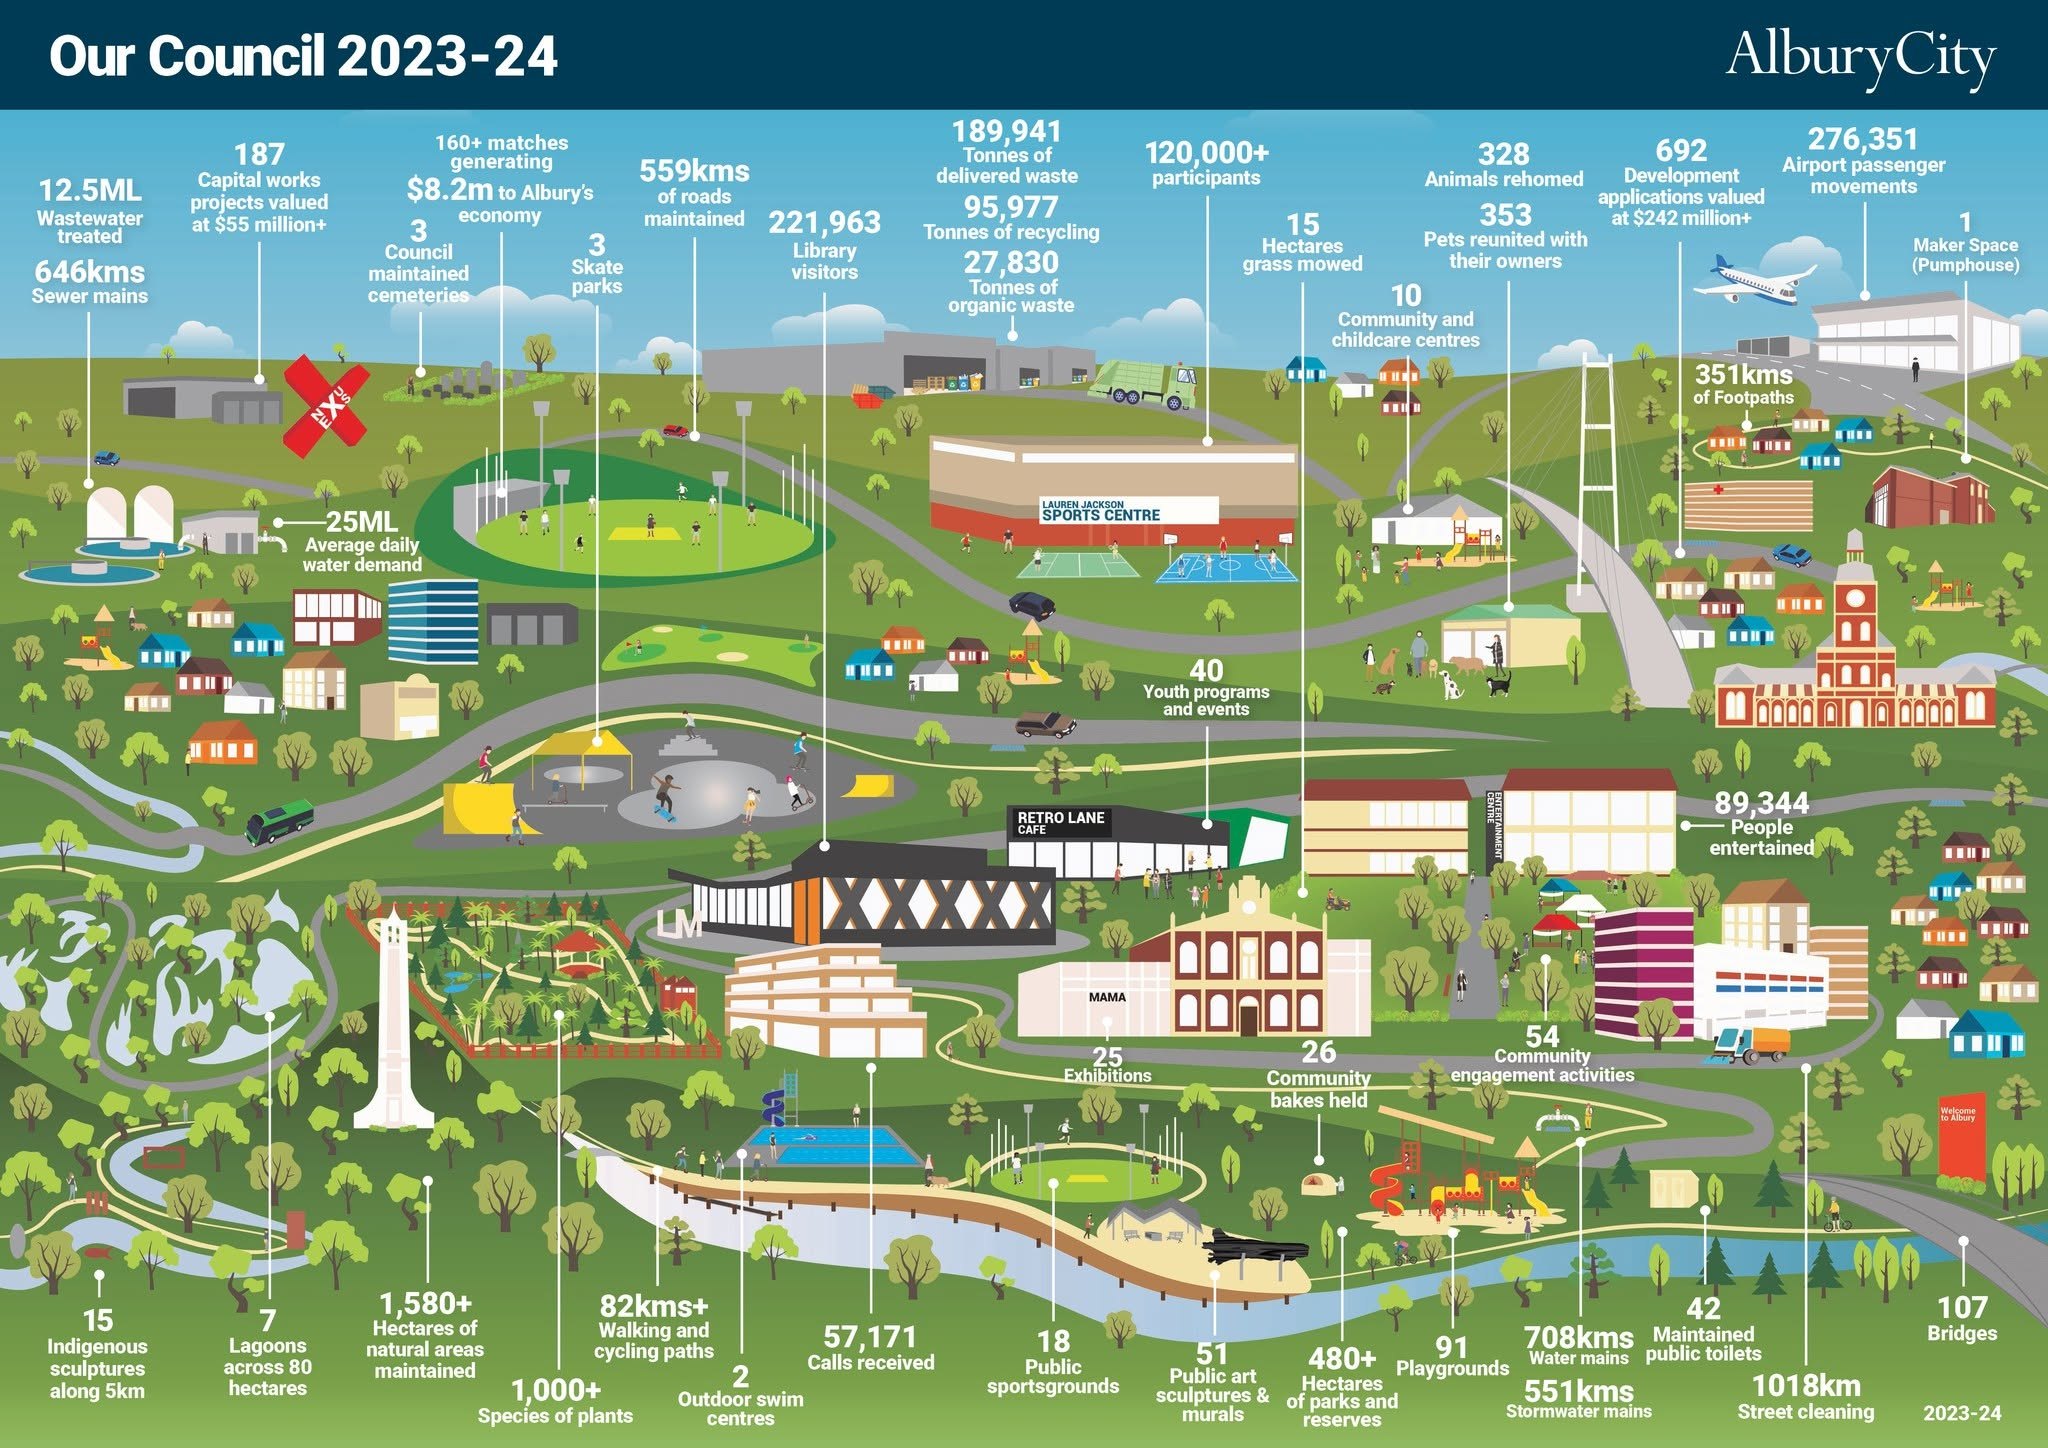
Albury at a glance
The infrastructure scale explains why maintenance and renewal matter. These are reported service quantities, not asset valuations. Each card is labelled by its reporting year; counts can change over time.
559 kmRoads maintainedFY2024 · Council annual report
704 kmWater mains servicedFY2025 · Council annual report
646 kmSewer mainsFY2024 · Council annual report
551 kmStormwater mainsFY2024 · Council annual report
349 kmFootpaths and shared pathways maintainedFY2025 · Council annual report
480+ haParks and reserves (about 1,186 acres)FY2024 · Council annual report
107BridgesFY2024 · Council annual report
91PlaygroundsFY2024 · Council annual report
759Properties and structures managed2026 Service Catalogue · p24
1,659Land parcels managed2026 Service Catalogue · p24
1,580+ haNatural areas maintained (about 3,904 acres)FY2024 · Council annual report
42Public toilets maintainedFY2024 · Council annual report
The 2026 catalogue reports a portfolio of 759 properties and structures (not necessarily 759 buildings) and 1,659 land parcels. Council also manages depots, fleet vehicles and plant; a verified total fleet count is not available from these cited summaries and is not estimated. Parks and natural-area land categories can overlap; they should not be added together. The counts for land parcels, maintained hectares and property structures describe different measures and are not additive.
See AlburyCity's original 2023–24 “Our Council” visual ↓
Everyday cash versus buying assets
Operations generate cash. Asset purchases spend it. Figures combine all funds.
Cash from operations Asset purchases
DEPRECIATION, EXPLAINEDThings wear out.
Things wear out.
Replacement costs money.
$39.9m
Depreciation is not a payment today. It measures the estimated consumption of assets. Keeping roads, buildings and pipes useful requires ongoing maintenance and renewal.
Important: Total asset purchases include new projects as well as replacements. They are not a direct measure of asset renewal performance.
2025 income statement, p4 ↗?
The renewal question
How much of the capital program replaces worn-out assets, and how much builds new ones that will need future maintenance? The report's published cash-flow totals alone cannot answer that — a separate asset-renewal schedule is needed.
07 / QUESTIONS FOR THE FUTURE
Five questions worth asking.
Can everyday income cover everyday costs?
Show the General Fund result before capital grants and a credible path back to balance.
What cash can actually be used?
Publish a clear split between external restrictions, internal allocations and working capital.
What is each loan paying for?
Link loan increases to approved projects, interest costs and repayment schedules.
Are we replacing assets fast enough?
Separate asset renewal from new infrastructure and show the condition of key assets.
Do services deliver value?
Compare cost, community need and service outcomes using complete, like-for-like data.
08 / CHECK THE EVIDENCE
Check the original sources.
Open Council’s published statements and catalogues to see where each figure came from.